
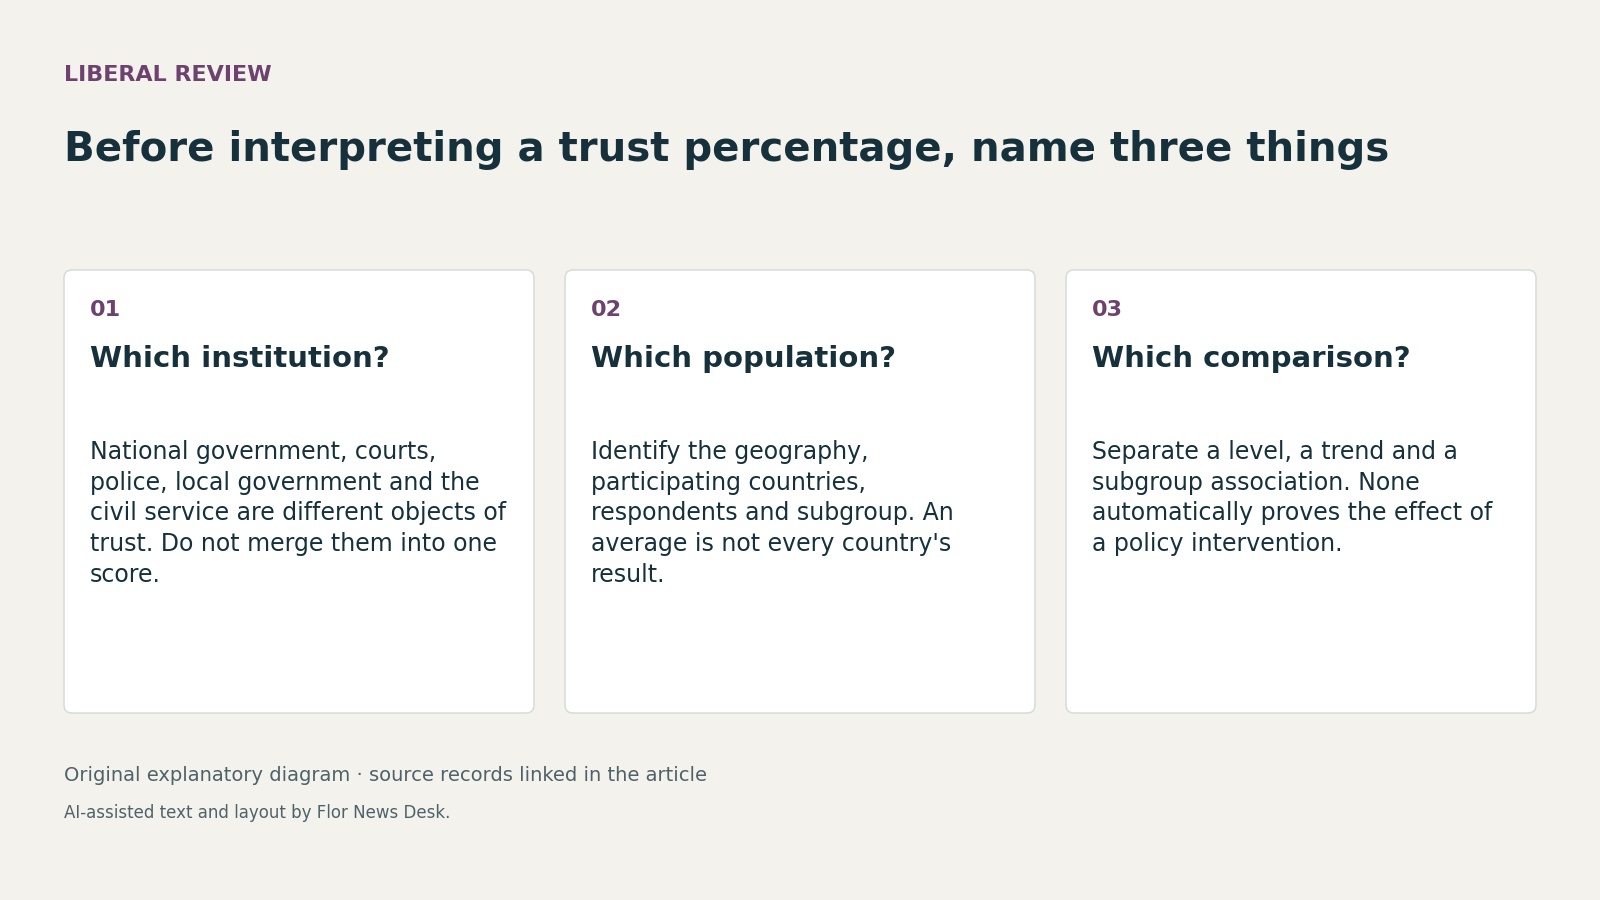
The OECD’s newest guidance on trust statistics arrives with a useful warning for political debate: a percentage about “trust in government” is not a general score for the whole public realm. It belongs to a named institution, a defined population and a particular comparison.
That distinction is easy to lose. The OECD’s June survey release reports that, across participating OECD countries, an average of 40% of respondents had high or moderately high trust in national government. Forty-three per cent reported low or no trust. A headline can stop there and invite a sweeping verdict.
The same release complicates that verdict. It says trust in the police, courts, local government and civil service tended to be significantly higher than trust in national government. If readers collapse those institutions into one category, they erase the very differences the survey is able to show.
The denominator is part of the argument
The September 16 Updated OECD Guidelines on Measuring Trust and Trust Drivers in Public Institutions are intended to help national statistical offices and international organisations collect comparable data. The abstract describes a move from experimental measurement toward more formalised standards and stresses statistical quality.
That goal does not make every comparison interchangeable. The June release covers 33 OECD countries and five accession candidates. Its 40% figure is an average across the OECD participants, not a result for every country and not a measure of every institution. A national figure, a cross-country average and a subgroup gap answer different questions.
The survey also reports a 47-percentage-point difference in national-government trust between people who feel they have a say in political decision making and those who do not. That is an association between reported perceptions. It does not, on its own, prove that one policy intervention would cause a 47-point increase.
This is where measurement language becomes politically important. A speaker can use a broad label such as “the public” while quietly switching between all respondents and a subgroup. They can compare a national government with local services, or one country with a multi-country average, without acknowledging that the object of trust has changed.
Comparison before conclusion
The OECD’s 2021 framework paper already emphasised variation across institutions, levels of government, countries and population groups. That paper is background, not evidence of a new 2026 result. The September guidelines build on earlier work and a decade of experience, according to their abstract.
A careful reading practice follows from these records. Before repeating a trust number, identify the institution, geography, survey population, response category and comparison period. Then ask whether the claim concerns a measured association, a trend or a proposed explanation.
Imagine two hypothetical headlines: “Trust in government is 40%” and “Average trust in national government is 40% across participating OECD countries.” The second is longer, but it preserves the institution and scope. Neither sentence describes a particular country until that country’s result is supplied.
This precision does not drain trust statistics of political meaning. It makes disagreement more honest. One reader may care most about confidence in long-term national decisions; another may focus on daily encounters with administrative services. Those are related questions, not identical ones.
The new guidelines matter because comparability requires disciplined categories. Public argument should meet the same standard. A trust percentage becomes informative only after the reader knows who was asked, which institution they evaluated and what comparison the number is meant to support.
Read our editorial standards or send a correction to the editorial desk.